

According to Yvonne Stacherski, Senior Marketing Operations Manager, Vice President at Comerica Bank, the company’s culture of sales presentations used to be “like the Wild West.” Salespeople were creating their own sales decks from scratch, which means they were collecting their own content. There was broad inconsistency across presentations, and a lot of inappropriate, even goofy images being used.
Salespeople would use SmartArt, icons, their own photos— whatever they happened to have at their own disposal.“The Comerica brand and core values weren’t always being represented properly, and this became a source of ongoing frustration for the marketing team.”
While the company certainly wanted the brand to be represented accurately in the marketplace, there was an additional and more serious compliance risk to this Wild West approach. For a financial institution like Comerica, disclosures are crucial to compliance. There was a major concern that salespeople weren’t being diligent in updating disclosures in their presentations, but company leaders didn’t have a way to audit presentations as a whole. Further complicating the issue, if a disclosure changed for one line of business, it might cross multiple lines of business.
This created a real risk for the organization, not just a risk to their reputation but the potential of legal and regulatory sanctions. Ultimately, it became the primary driver in seeking a system that would give the company better control over their presentations.
Comerica adopted the Shufflrr Presentation Management system because they wanted something that gave them holistic control of their presentations but was flexible enough to meet the needs of every division in the company.For example, their wealth and commercial divisions needed to be able to change out company names and insert logos to make more personalized content for clients.
At the same time, they needed a system of record for their presentations so internal auditors could ensure at any point in time that everything was compliant. With Shufflrr, they had the ability to set appropriate permissions throughout the organization, and it also created a chain of custody for presentation communications.
Finally, they wanted technology that enabled their sales reps, and others, to interact with sales presentations anywhere.
As Yvonne put it, “We wanted high-quality, interactive sales presentations anytime, anywhere.”
tions anytime, anywhere.”
As soon as Comerica embraced Structured Storytelling and began creating their own slide library, they discovered how much easier it is to create and manage presentations. They decided the best way they could help users was to structure their slides into chapters, with each chapter dedicated to one of the company’s divisions: retail banking, business banking, and wealth management.
Recently, they did a brand refresh, and they discovered that their Structured Storytelling library makes it incredibly easy to transition to the new look and feel. Their brand redesign gave them a newer, more contemporary look, but it meant all of their slides had to be updated in a rather short period of time.
Under the old approach, this would have been impossible because all of the files throughout the network were not accounted for. Now they have the tools for each department to go in and update their content and republish it. They can each work in their own separate folders, and as long as the library is active, changes will be implemented at the same time across the organization.
Once the changes are implemented, the updated slides are placed in new folders, and the permissions on the old folders are simply turned off. That way, when a team member logs in and looks for slides, everything they see has the new look and feel. The company doesn’t have to worry about someone accidentally pulling out an old slide with the old look. Think about it like pulling an old book off the shelf in a library and replacing it with a newer edition. From that point on, anyone who accesses the book will be pulling the new one off the shelf.
An Evolving Cycle
All of this provides an example of the endless circular life cycle that slides go through with Presentation Management.
The first step in the life cycle is creation. As the name suggests, this refers to the act of creating slides and other 63 content for presentations. Ideally, in a Presentation Management system, slides are created by content admins, usually someone in marketing. Content admins make sure that every piece of content is formatted as a slide, and that every slide is on brand and on message. They also set controls in the library for things like font and color.
The admins organize everything into chapters and folders that tell the corporate story. Much like the table of contents in a book, each chapter is clearly defined. You can go back and look at the table of contents at the beginning of this book to see an example of a structured story presentation of each chapter.
With Comerica, there is a chapter for each division of their company. A pharmaceutical company might have a chapter for each scientific area, then a subchapter for each disease state. A media company might have chapters for each network and subchapters for each show. A hotel chain might have chapters for each brand, from luxury to economy. A manufacturing company might have one chapter for materials, another for distribution, and other chapters for products. And so on. Typically, a company will also have a chapter-folder for their company history, a chapter-folder for marketing materials, a chapter-folder for sales, for R & D, and perhaps a chapter for investors.
When we worked with Mercedes-Benz, their structured story included chapters for Safety, Innovation, Performance, 64 and Style and Design. Notice they led with concepts and ideals rather than car models and pricing. Products and prices change every day, but your company mission, ideals, and brand stay constant. They are at the core of the story— they are the presentation. The specifics about cars and pricing are slides—they are the scenes. Every presentation is a story, and every slide is a scene.
Once a slide is created, it is distributed through your Presentation Management system into the cloud to be accessed and reused by anyone with permission. This goes hand in hand with sharing, when content is made available to people inside and outside of the enterprise. When a user accesses the slide library at this point, it’s a bit like shopping on Amazon. You find your relevant folder, pick the slides you want, put them in your slide cart, and hit save. Then you’re out the door. The content admins make it that easy for you.
Let’s suppose you’re a salesperson getting ready for a presentation in Mexico. All you have to do is log into the slide library, and all of the content will already be organized and formatted for you. It’s presented to you visually as well, so you’re not hunting through file names for the right slide. You open relevant folders based on theme, select appropriate slides, and click and drag them into your slide cart. You can also use a search feature to find specific slides by keyword, and the search results are presented visually as well.
65 Let’s suppose you’re looking for a specific white paper about regulatory changes to your industry. You open the search bar and type, “Regulatory changes,” and a few relevant slides appear in your search results. Because they’re visual, you can quickly scan, find the specific white paper you want, then drag and drop it into your slide cart. It’s as simple as that. The white paper is already formatted, on brand, and on message, so it’s ready to go. However, you can edit the slide with some additional customizations tailored to your presentation, if you want—perhaps a bit of information relevant to a specific client.
Do the same for the rest of the slides in your presentation, then save it, and you’re ready for presenting. Now you have a few options: present in person with a face-to-face meeting; broadcast your presentation remotely through Zoom, Teams, Skype, or WhatsApp; or send a secure, encrypted link and let the audience look at your slides on their own time. Presentation Management software will send you a notification when the file is opened, as well as which slides are looked at and for how long.
Social refers to the comments and feedback you receive after a presentation, which you can then respond to, as well as internal comments and feedback from your team about slides. In a face-to-face meeting, this might take the form of direct questions and comments on the content of specific slides. With a structured slide library, you have easy access to additional slides so you can respond to this feedback 66 right then and there. Instead of “Let me get back to you about that,” you get to say, “I have some information about that right here.”
Then there’s reporting, which means the internal and external gathering of data about how content is being used to better understand what’s most effective. With good Presentation Management software, you can track, audit, and analyze your slides to see who presented what, when, and where. You’ll know who the best presenters are, and you’ll see what clients are responding to most strongly. In fact, you can track what is resonating most powerfully with clients in real time, down to the individual time spent on specific slides.
While social gives you anecdotal feedback—what people say—reporting gives you analytical feedback—what people actually do. Together, they provide emotion and logic, which are both critical for telling a story and turning emotion into motion.
“I see our best presenters spend an average of ten minutes on this particular slide, then seven minutes on this widget, but they tend to skip this other slide over here.”
It’s feedback and data more powerful than any focus group or research survey about client interests, and you can use 67 it for updating and improving slides accordingly. Slides that are effective can be made more effective, while slides that don’t work can be retired. You can create more of the content that’s impactful, and clean out the stuff that never gets used (or shouldn’t be used).
As you edit and update content, the updates are pushed out to every user’s presentation. For example, if you change pricing information on a slide, it will be changed in every individual presentation that uses your slide library. This ensures that every presentation has current, relevant, and consistent information. There’s a parent–child relationship between the slides in the slide library and the slides in individual presentations, which plays an important role in the slide life cycle. Additionally, when you present data from research companies (e.g., stock prices from Morningstar), the data gets updated by the minute, so it’s always current in the child slide.
We will go into more detail about this parent–child relationship in Chapter 10, when we examine the genealogy of slides.
That brings us back around to creation, and the life cycle starts all over again. As Bob Davis, Associate Vice President of Marketing for HealthTrust Purchasing Group, put it, “Our presentations never finish.”
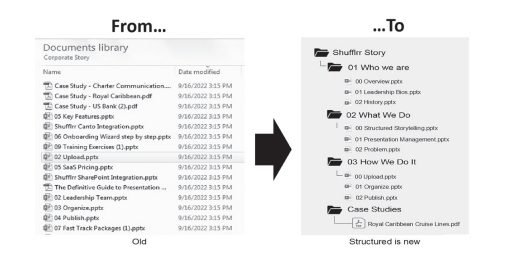
Under the old linear slide system, content exists on network folders, new folders tend to get created over time, and nothing gets deleted or cleaned out, so after a few years, you have a giant mess. Now there’s a constant evolution so content gets improved or retired constantly through the publishing process.
We can all relate to working on SharePoint sites and network folders, watching them get bigger and messier over time as people add more and more content without regard to quality or usefulness. With a culture of Presentation Management, slides follow a distinct life cycle that keeps them relevant and easy to find, with correct information that is regularly updated to meet the most current needs of the organization.
Anything that’s in the library has been approved by all the requisite departments (legal, marketing, product development, et al.), and the content design is current, so any rep can pull it out and use it without worrying if it’s correct in every aspect. With Presentation Management, your slide library will never be messy again, and compliance issues are a thing of the past, because it’s being managed, and every slide is a living, breathing piece of communication.
Ever-Evolving And Updating Files
It makes your slide library a living, breathing thing that evolves along with your company, so your team never again has to fumble around or waste time trying to put together brand-new presentations from scratch. Additionally, everyone is always using the right information about your company and telling a consistent, unified story.
Consider the example of Comerica. Through their brand refresh, they were able to keep every presentation consistent with updated information, logos, fonts, colors, and more, because every slide is updated globally when the parent slide is updated. That means they could roll out changes to the entire organization as they saw fit. They no longer had to worry about some individual in the organization accidentally continuing to use out-of-date content.
But Structured Storytelling takes it a step further. Imagine presentations that are connected to live data so they are constantly updated. For example, a slide showing the performance of the stock market could be connected to the stock exchange so it always has current stock prices, or a slide about the weather connected to the National Weather Service to show the latest forecasts in your area. The moment someone opens the slide, they see the most current data.
We spoke to Kurt Dupont of PresentationPoint about this aspect of Presentation Management. He has spent just as many years as we have working on presentations, but his primary focus is adding live data to slides and automating them. As an expert on the use of live data in slides, we’ve worked closely with him over the years. Here is what he had to say.
Evidence is always convincing. Properly formatted data presentations are storytelling for evidence.
We began to use live data twenty-five years ago, when we worked on creating real-time flight information for airport screens. For a long time, PowerPoint presentations were static, so we created a plug-in called DataPoint that enables users to connect their presentations to twenty-five different data providers. Now 71 presentations can connect shapes like text boxes, tables, graphics, and charts to databases that provide regularly updated information. As soon as a user opens a presentation, the latest information from relevant data sources is applied.
For example, a McDonald’s franchise might create a presentation with their menu options that displays on restaurant screens, and a direct connection to headquarters will constantly update menu items and prices. This could be done at every McDonald’s restaurant around the world, ensuring that every screen is being updated in real time, and the presentations can be customized for individual locations, so the display will be different at a McDonald’s in Singapore versus a McDonald’s in Kansas City.
This also allows for what is called ‘mail merging,’ where you can maintain a constantly updated list of slides for every product you sell in your database. In a presentation, you could show information like number of items sold last week or current product pricing, and it would all be updated as soon as you opened the slide. Additionally, you can create personalized presentations for each customer based on the products they are interested in, and the product information will be up-to-date with the latest images, pricing, and so on. In fact, this is how insurance companies generate customer proposals for individual clients.
The point is, slides can be database-driven; customized according to time, place, and location; and targeted to a specific audience. Imagine a hospital with twenty different locations. A patient enters one of those locations, and a display screen greets him with personalized information: “Welcome, Jacob. Your physician, Dr. Bob Schwartz, is ready to see you in room 125.”
Your presentation can also be scheduled along a specific timeline, not unlike television programs on a broadcast cable network. So maybe the menu at the restaurant changes at a specific time of the day when the kitchen shifts from breakfast to lunch.
You’re controlling the message, data, and statistics on every screen at all times. From virtual church services to business signage, distance learning, financial planning, road signage, and military planning, the direct connection to live data empowers presentations in so many amazing ways, we can’t possibly mention them all.Now your audience is able to make intelligent, informed decisions, and you know that you have the latest and most accurate data every time you open a presentation.
Start Cleaning Your Room
The good news is you already have everything you need to get started. All you have to do is collect your best presentation content, bring it all together in a shared folder, and then begin organizing it. How do you begin cleaning a dirty room? First, you drag everything out into the open so you can begin to identify and organize it.
As you begin to organize your content into separate chapters, you will discover many files that need to be updated.You’ll see gaps in your structured library. For example, you may realize, “We need more case studies! Let’s start contacting clients to see if they will participate. Also, our office in Texas isn’t represented anywhere.”
You’ll discover which new slides need to be created, what information needs to be updated, and which out-of-date or irrelevant content needs to be deleted. Once your content is formatted, updated, and organized, you’re ready to publish it so the rest of your organization can access it.
Of course, there will probably be different user groups throughout your organization who need access to different slides, and you can set those permissions as well.Certain sections of your library may only be accessible to salespeople, or HR, or your training team, and some sections will only be accessible to your executive team. At Comerica, the banking group doesn’t need access to the slides for the wealth management group because they’re completely different lines of business. So, they will be pulling slides from different folders within the same global library.
All of these permissions are easy to add, remove, and adjust throughout the life cycle of each slide by your content admins, so that any individual user who accesses the slide library knows that the content available to them is content they’re allowed to use. Permissions can be set per slide, per folder, and per user group, and there are two different stages of permissions: consumers and publishers. Consumers can access the slides for presentations, while publishers can also create and publish slides.
You might also begin connecting some of your slides to realtime data sources, so you know you always have the latest information. This is where a product like DataPoint can come into play.
This organization is such an important part of Structured Storytelling that we’ll look at the process of uploading, organizing, and publishing in greater detail in the next chapter.